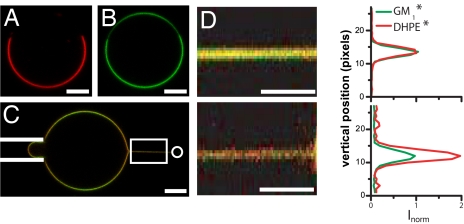
Fig. 1.
Partitioning of fluorescent lipid dyes in GUVs and membrane nanotubes. (A and B) Confocal equatorial section of a 43:14:43 GUV showing the distribution of DHPE* [red (A)] and GM1* [green (B)] between 2 coexisting Lo and Ld phases. (C) Typical confocal image showing a tube pulled out of a 30:35:35 vesicle. A bead (not visible in fluorescence and represented by a white circle on the right side) trapped in the optical tweezers is bound to the vesicle. The vesicle is aspirated in a micropipette (left side, depicted with white lines) to set membrane tension and moved away from the trap to form a tube. Note that the intensity in the green channel is modulated along the vesicle contour because of the polarization of excitation light. This effect is taken into account in the data analysis. (D) Influence of membrane curvature on tube composition. (Upper) Confocal image (Left) of a membrane tube pulled out of a 30:35:35 GUV (zoom of the boxed region in C; the tube radius is 70 ± 10 nm) and corresponding tube length-averaged fluorescence profile for GM1* and DHPE* (Right). (Lower) Decreasing the radius of the above tube down to 20 ± 2 nm increases lipid sorting. DHPE* is approximately twice more concentrated than GM1* in the tube. For each dye, Inorm is the fluorescence intensity in the tube normalized by the fluorescence intensity in the vesicle and by the maximum of fluorescence of GM1* in the tube. (Scale bars, 5 μm.)

