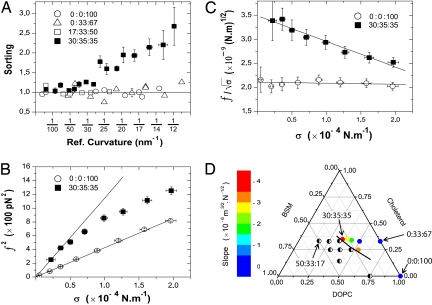
Fig. 2.
Curvature-driven lipid sorting occurs only close to a phase separation. (A) Sorting of DHPE* to GM1* as a function of the reference curvature (Ref. curvature) for different lipid mixtures. For clarity, only 1 representative error bar is presented for the 0:0:100, 0:33:67, and 17:33:50 datasets. Data are binned over 4 points (n = 12 vesicles for 30:35:35; n = 10 for 0:0:100, 0:33:67, and n = 7 for 17:33:50; error bars represent standard error of the mean). The horizontal line (sorting = 1), a guide to the eye, corresponds to the absence of sorting. (B) Squared force f2 vs. σ for typical 30:35:35 and 0:0:100 vesicles. A linear fit of f2 vs. σ according to Eq. 1 gives κv = 15 ± 3 kBT for the 0:0:100 composition. For the 30:35:35 composition, a clear deviation from linear behavior is observed. The line corresponds to a linear fit of the first 3 points. Error bars correspond to experimental precision. (C) A linear fit to f/ vs. σ according to Eq. 4 gives a slope of 5.1 10−6 m3/2.N−1/2 for 30:35:35 and 0.2 10−6 m3/2.N−1/2 for 0:0:100. From the extrapolation to σ = 0, we find κv = 38 kBT for 30:35:35 and κv = 15 kBT for 0:0:100. Error bars correspond to experimental precision. (D) Schematic phase diagram summarizing the evolution of sorting effect with membrane composition at T = 22 ± 1 °C. The color scale illustrates the average slopes extracted from the linear fits to f/ versus σ plots (see Table S1). Half-filled circles, compositions showing phase separation; black line, phase boundary deduced from our observations (SI Appendix).

