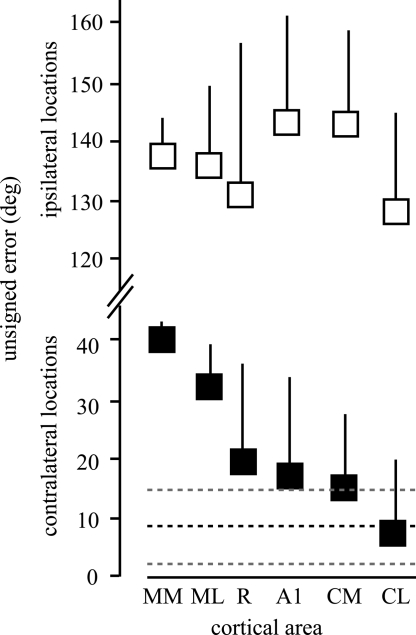
Fig. 3.
Mean unsigned errors from the maximum likelihood estimator using neuronal populations from different cortical areas. Means and SDs from human subjects are shown as heavy and light dashed lines, respectively. Ipsilateral (open squares) and contralateral (filled squares) locations are shown. Note the break in the y axis. Paired t tests between the model (contralateral) and human results resulted in P values of 0.0002, 0.0035, 0.0159, 0.0425, 0.0395, and 0.5233 for MM, ML, R, A1, CM, and CL, respectively.

