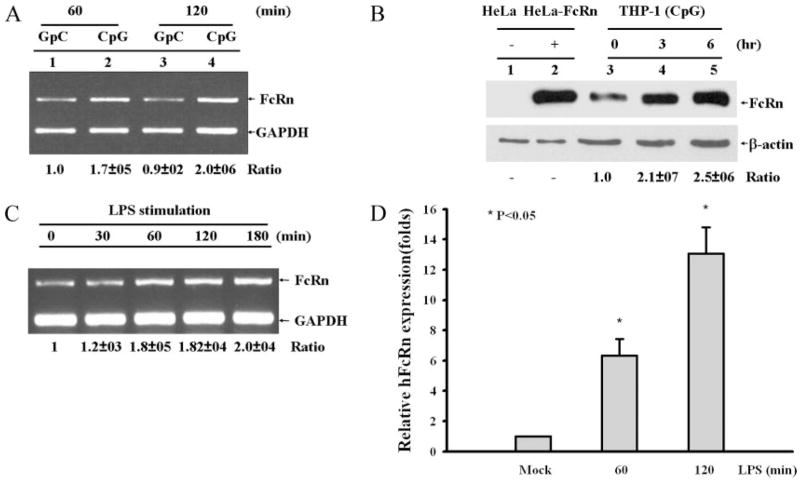
FIGURE 2.
FcRn expression in response to CpG or LPS stimulation. Densitometric intensity analyses of the RT-PCR experiments were conducted. The ratios of FcRn to GAPDH are shown. Similar results were seen in three independent experiments for each condition. A, THP-1 cells were stimulated with 4 μg/ml CpG or mutant GpC for 60 and 120 min. A representative sample for RT-PCR analysis using total RNA extracted from the cells was shown for FcRn and GAPDH. B, Western blot analysis of FcRn expression. The cell lysates (10 μg) from HeLa (lane 1), HeLa-FcRn (lane 2), and CpG-stimulated THP-1 (lanes 3–5) were subjected to electrophoresis with 12% SDS-polyacrylamide gels under a reducing condition and transferred to nitrocellulose membrane. Immunoblotting was performed with affinity-purified rabbit anti-FcRn Ab (top) or β-actin (bottom) and a HRP-conjugated secondary Ab with development by ECL. The ratio of the mock group is assigned a value of 1.0, and the values from other groups are normalized to this value. The ratios of FcRn to β-actin are shown as indicated. C, THP-1 cells were pretreated with PMA and 1,25-dihydroxy vitamin D3 for 6 days and then stimulated with 1 μg/ml LPS for the indicated time. A representative sample for RT-PCR analysis using total RNA extracted from the cells is shown for FcRn and GAPDH. D, Quantitative real-time RT-PCR analysis of FcRn mRNA from freshly isolated human monocytes treated with LPS (1 μg/ml) for the indicated times or left untreated. Data are mean ± SD of three independent experiments. *, p < 0.05.

