
Figure 3.
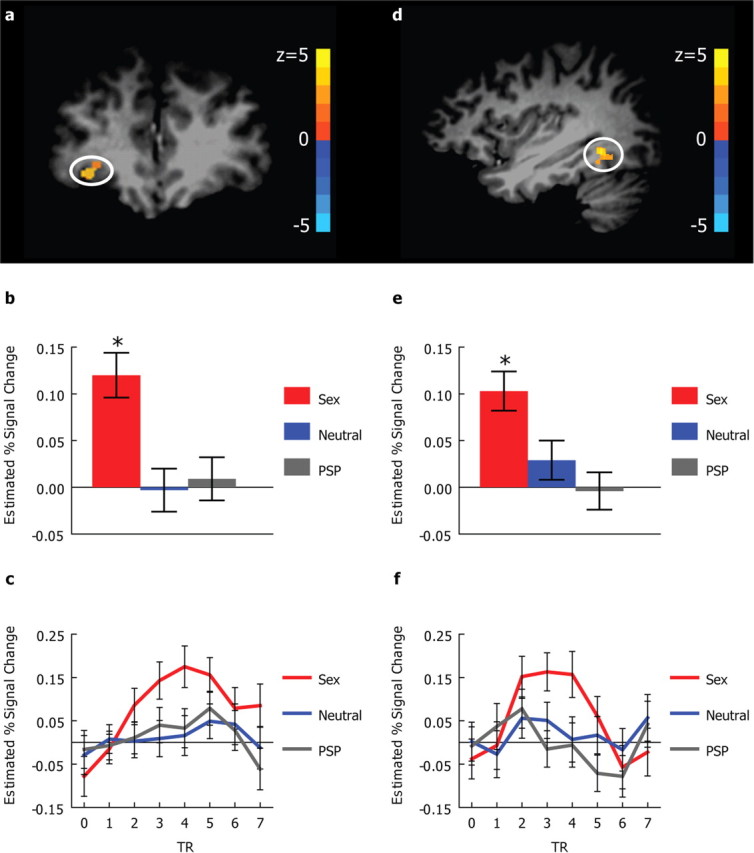
Brain responses to social chemosensory compounds. a, Coronal view showing an area in the right orbitofrontal cortex (33, 40, −1) activated in the omnibus ANCOVA F test (svc p < 0.005). b, The means and SEs of the estimated percentage signal change in the right orbitofrontal region. c, The time courses of the hemodynamic responses in the right orbitofrontal region. d, Sagittal view showing a region in the right fusiform gyrus (35, −51, −7) activated in the omnibus ANCOVA F test (uncorrected p < 0.0005, cluster size = 49 mm3). e, The means and SEs of the estimated percentage signal change in the right fusiform region. f, The time courses of the hemodynamic responses in the right fusiform region. In a and d, the activation map (omnibus F test) is overlaid on top of a high-resolution T1 image in Talairach space. In c and f, 0 on the x-axis refers to the onset of the olfactory stimuli. In b, c, e, and f, the response to PEA is used as the reference level. Sex, Sexual sweat; Neutral, neutral sweat. *p < 0.002, Bonferroni corrected.