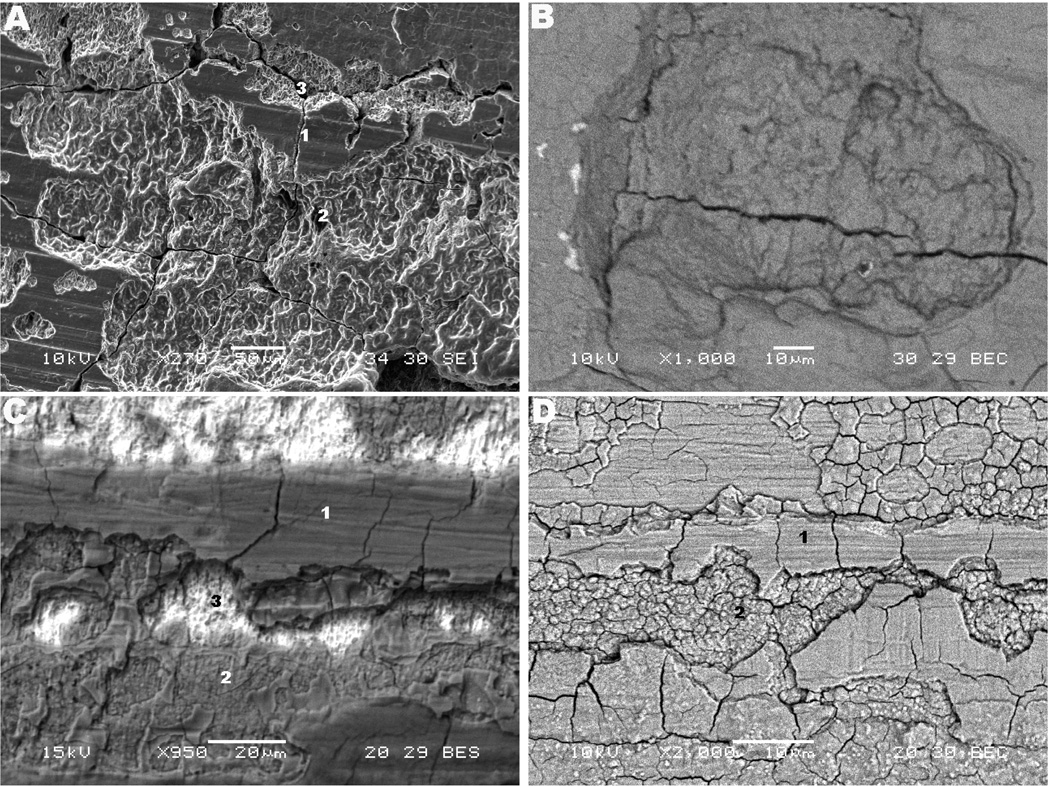
Fig. 4.
SEM micrographs of cracking patterns in the three designs and structure of delamination. (a) and (b) Z lateral proximal female taper (270×) and medial proximal female taper (1,000×), respectively. (c) and (d) M posterior medial proximal female taper (950×) and anterior medial proximal female taper (2,000×), respectively. In the Figures, the features numbered as 1, 2, 3 represent top layer (metal surface), intermediate layer and microstructure, respectively.

