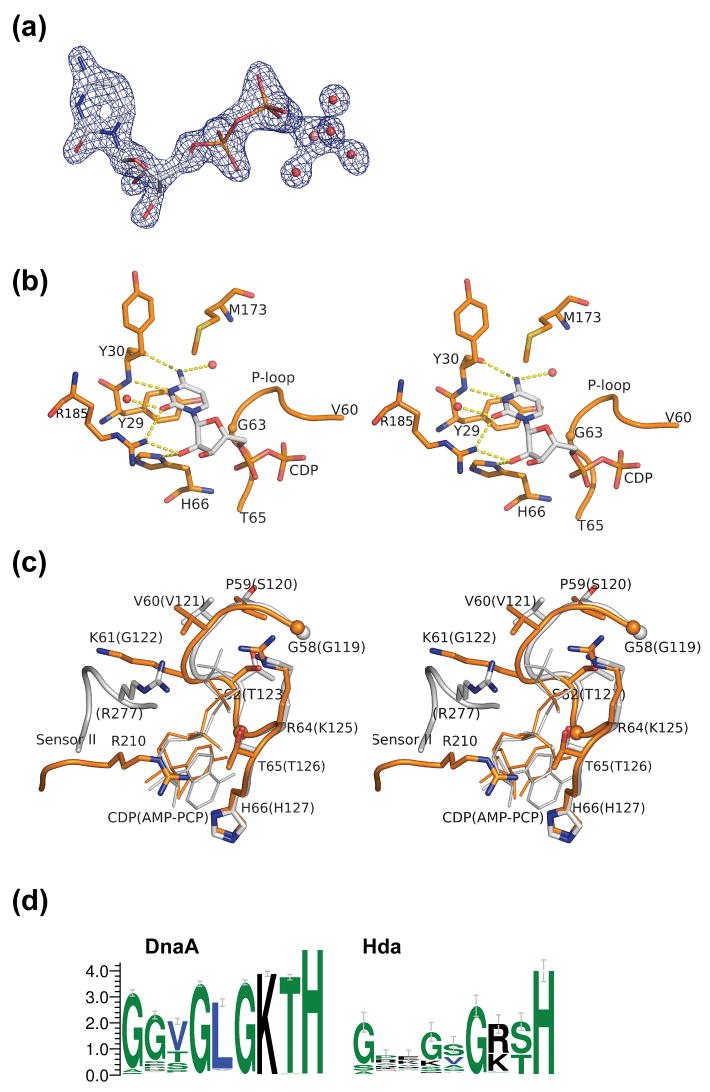
Figure 3.
Nucleotide binding site of Hda. (a) The CDP (shown in sticks) with the experimental density contoured at 2.5σ. The map was calculated after density modification improvement of the initial MAD phases. The conserved magnesium ion (pink), coordinated by waters (red), and Thr65 (not shown) stabilize the β-phosphate of the CDP. (b). Interaction between the protein and the cytidine base and sugar of CDP. (c) Comparison of motifs Walker A and sensor II of Hda (orange) and DnaA (gray). The corresponding residues for DnaA (PDB id 2hcb) are shown in parenthesis. (d). Sequence conservation pattern of the P-loop region of putative DnaA and Hda proteins. The DnaA group of sequences (785 sequences) are selected based on the presence of both a C-terminal DNA binding motif, as well as an ATPase domain. The putative Hda sequences (94 sequences) are selected by full-length homology to E. coli Hda and of length between 210 and 270 residues.

