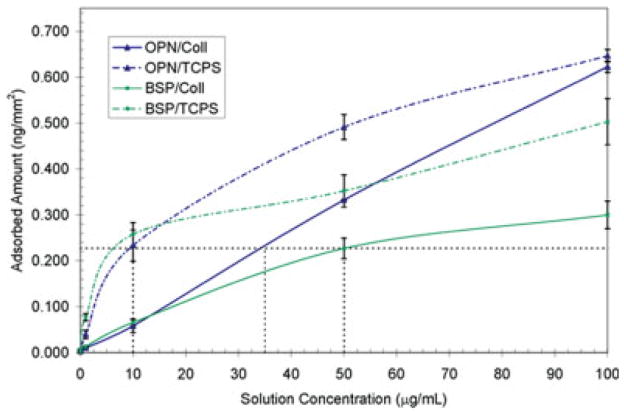
Figure 2.
125I radiolabel adsorption isotherms for BSP (squares) and OPN (triangles) on two substrates: TCPS substrates (dot–dash lines) and collagen-coated TCPS substrates (solid lines). The dotted lines represent the protein exposure concentrations used for the cell adhesion assays. The data for the OPN cases were taken from Liu et al.26 [Color figure can be viewed in the online issue, which is available at www.interscience.wiley.com.]

