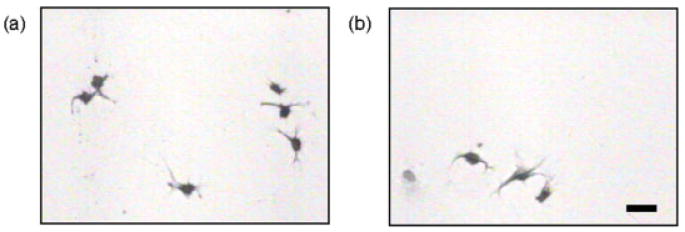
Figure 4.
Optical microscopy images of MC3T3-E1 cells on different control surfaces: (a) 1 mg/mL heat denatured BSA adsorbed on TCPS and (b) 1 mg/mL heat denatured BSA adsorbed to collagen-coated TCPS. The scale bar represents 50 μm. [Color figure can be viewed in the online issue, which is available at www.interscience.wiley.com.]

