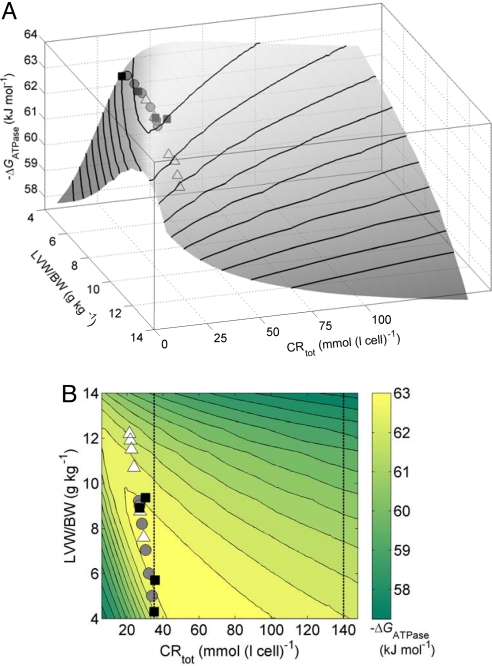
Fig. 3.
Effects of CRtot on the cardiac energetic state in LVH. Model-predicted ATP hydrolysis potential ΔGATPase at maximal MVO2 is plotted as a function of CRtot and LVW/BW. For each value of LVW/BW, the TEP and TAN pools are fixed at values determined for the analysis illustrated in Fig. 2. Data points for LVH canine heart are plotted using the symbols defined in the legend of Fig. 2. The same results are illustrated as a surface projection (A) and a contour plot (B). The vertical lines in B indicate the normal baseline CRtot and a 4-fold increase over normal.

