
Figure 5.
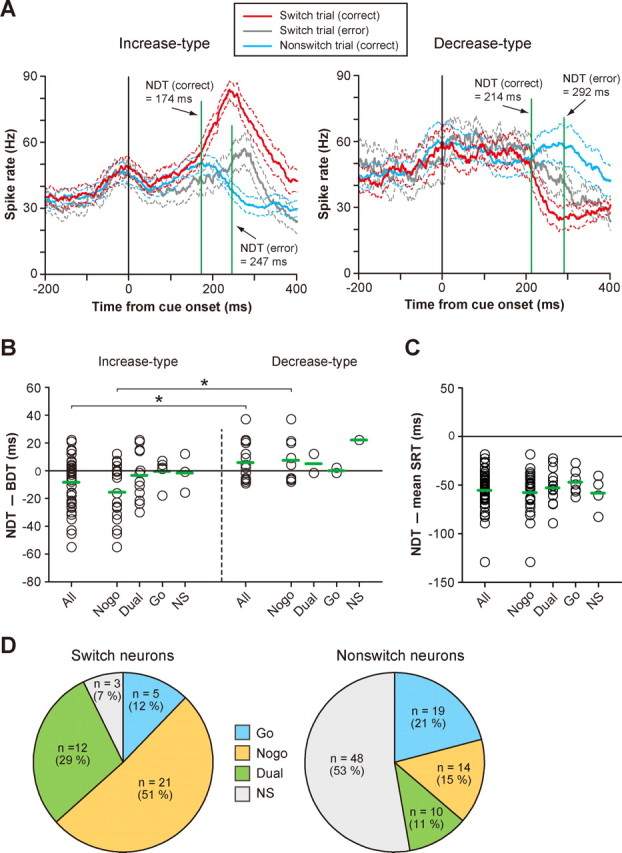
Population summary of switch-selective activity. A, The neuronal differentiation time (NDT) for the population of switch-selective activity. Ensemble-averaged SDFs (mean ± SD) for the increase type (left) and the decrease type (right) in the correct switch trials (red), incorrect switch trials (gray), and correct nonswitch trials (blue) are shown. SDFs are aligned with cue onset. Note that, for this comparison, the direction of the saccade target in the switch trials is opposite that in the nonswitch trials (see Materials and Methods). B, The neuronal differentiation time of individual switch-selective activity for the increase type (left) and decrease type (right). Plotted along the ordinate is the neuronal differentiation time relative to the behavioral differentiation time. Negative values indicate that neuronal differentiation occurred before behavioral differentiation. Switch-selective activity is grouped by its functional subtype. Green horizontal arrows represent the mean. Bilateral-switch neurons yielded two data points. *p < 0.01. C, Comparison of the neuronal differentiation time with the mean SRT obtained from each session. The increase type and decrease type are combined together. Negative values indicate that the neuronal differentiation time preceded the average SRT. Green horizontal arrows represent the group mean. D, Frequency distribution of functional subtypes for switch neurons (left) and nonswitch neurons (right).