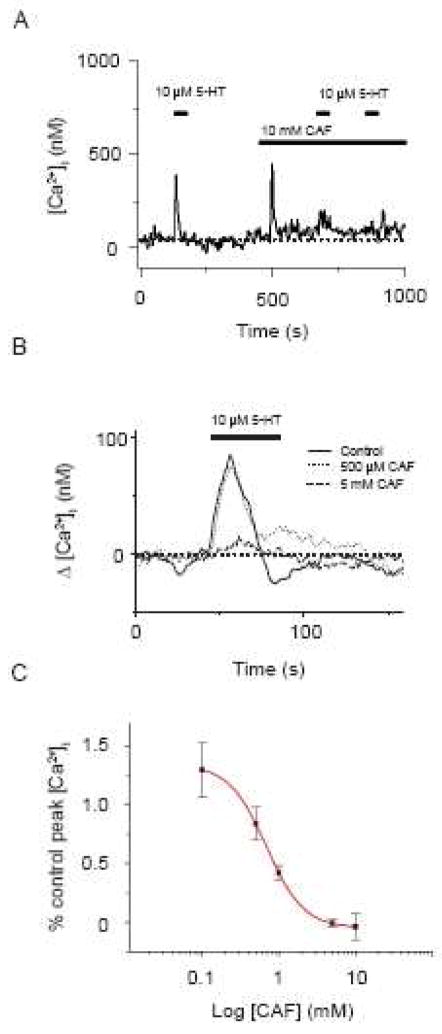
Figure 3.
Caffeine blocks 5-HT elicited cytosolic [Ca2+] increases in PASMCs. (A) 10 μM 5-HT induced Ca2+ transient in the absence then presence of 10 mM caffeine. Agonists were present at times shown by the horizontal bars. Dashed line shows the resting cytosolic [Ca2+]. (B) Dose dependent inhibition of 10 μM 5-HT induced Ca2+ transients by caffeine. Solid line is the resultant dose-response curve fitted to the data with a simple binding equation. Values are means of % peak Ca2+. Error bars represent ± S.E.M for 8 to 10 cells at each concentration of caffeine evaluated.

