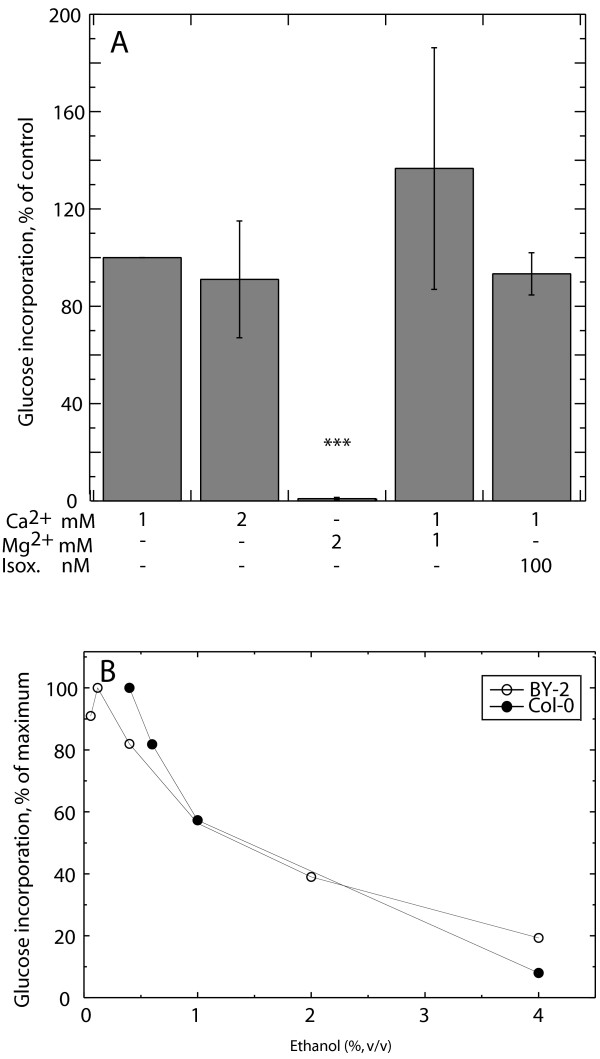
Figure 4.
Characterization of callose synthase activity. (A) Experiments were performed on Col-0 cells treated with 20 μg ml-1 of alamethicin in assay medium complemented with various amounts of Ca2+, Mg2+ and isoxaben (Isox.). Activities for each independent experiment are presented relative to the activity in the presence of 1 mM Ca2+. The average activity with 1 mM Ca2+ was 45 nmol min-1 g-1(FW). Values represent averages of at least three independent experiments except for the 2 mM Mg2+ experiment which was determined twice. (B) The effect of ethanol addition of callose synthase activity in Col-0 and BY-2 cells. Each curve represents one independent experiment. The maximum activity was 45 nmol min-1 g-1(FW) in Col-0 and 10 nmol min-1 g-1(FW) in BY-2 cells.

