
Figure 2.
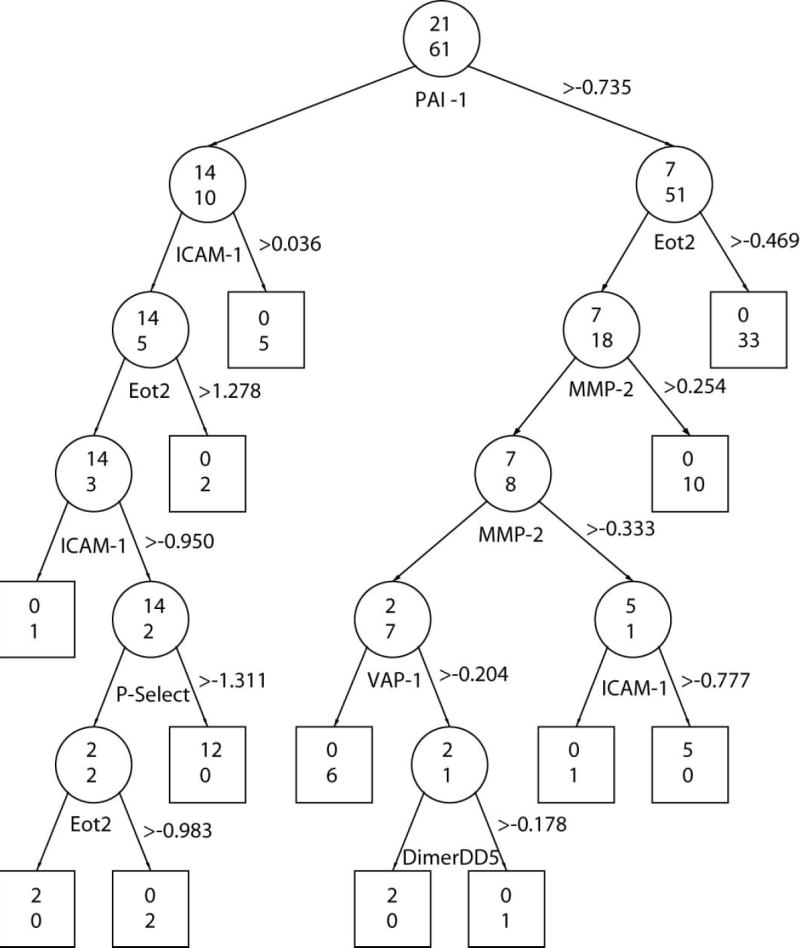
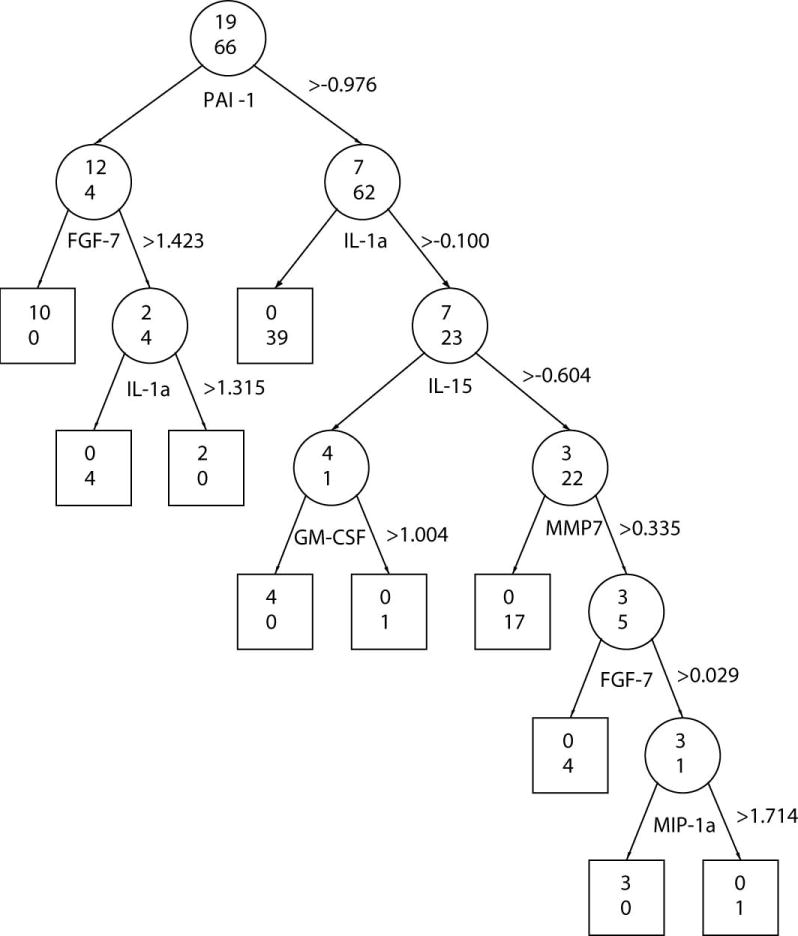
Classification Tree Using Proteins that were Different at Initial and Classifying X-ray Visits. Recursive regression tree classification of OA cases and control samples based on protein amount observed at the time of the initial x-ray (A), and at the time of the classifying x-ray (B). Beside each protein appears the threshold z-score used to classify samples. The odds ratios associated with each protein appear in the brackets. Two numbers are displayed on each node (depicted as circle for nonterminal nodes or square for terminal nodes): the number of samples classified as OA by that protein is shown on the top and the number of participants classified as controls is shown on the bottom. The misclassification error rate was 0.061 for Figure A, and 0.071 for Figure B.