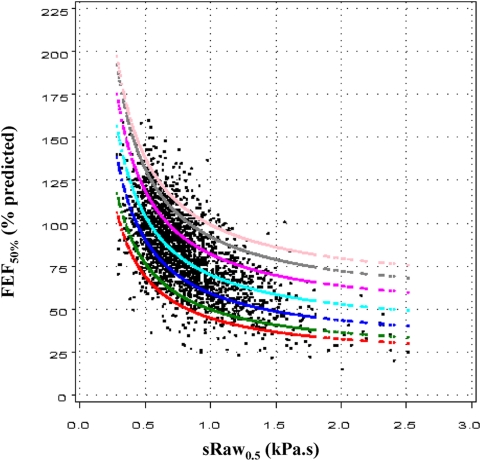
Figure 2. Quantile regression models in which a specified conditional quantile (or percentile) of FEF50% was expressed as a linear function of the inverse of sRaw0.5.
The 5% (red line), 10% (green line), 25% (dark blue line), 50% (blue), 75% (dark pink line), 90% (grey line) and 95% (pink line) percentiles are shown. When using quantile regression by examining multiple percentiles rather than only the mean, one can examine how the entire distribution of FEF50% changes with sRaw0.5.

