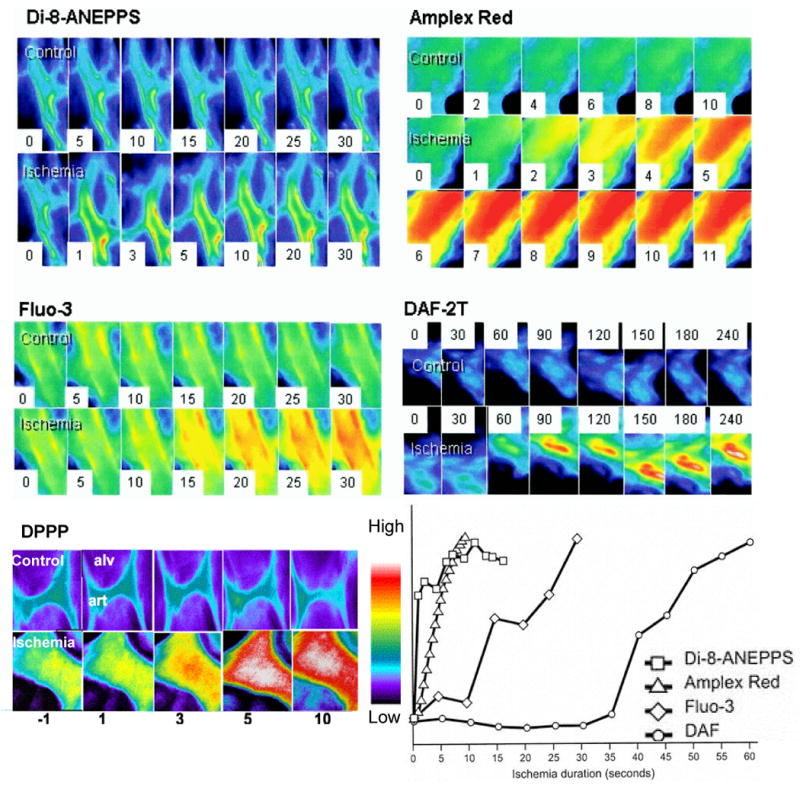
Fig. 1. The acute response to ischemia.

As detected by fluorescence imaging of subpleural microvascular endothelium in the isolated rat lung. Each set of images represents a control perfusion period followed by ischemia. Images are in pseudocolor, with red indicating higher fluorescence. The number on each panel indicates time in seconds (minutes for DPPP) either during control observation period or after cessation of perfusion. Top, left, imaging for cell membrane potential using the fluorophore di-8-ANEPPS. Top, right, imaging with amplex red for the appearance of H2O2 in the intravascular space. Middle, left, imaging for intracellular Ca2+ with fluo-3. Middle, right, imaging for nitric oxide with diaminofluorescein (DAF). Bottom, left, imaging for lipid peroxidation using hydroperoxide probe DPPP. The preset scale indicates the pseudocology scale used in all these images. Bottom, right, timing of fluorescence changes in membrane potential, reactive oxygen species generation, intracellular Ca2+, and nitric oxide generation with ischemia as determined by imaging techniques in the isolated rat lung. The y-axis represents arbitrary units. DAF, diaminofluorescein and DPPP, diphenyl-1-pyrenylphosphine. Reprinted with permission from [51, 55, 65].
