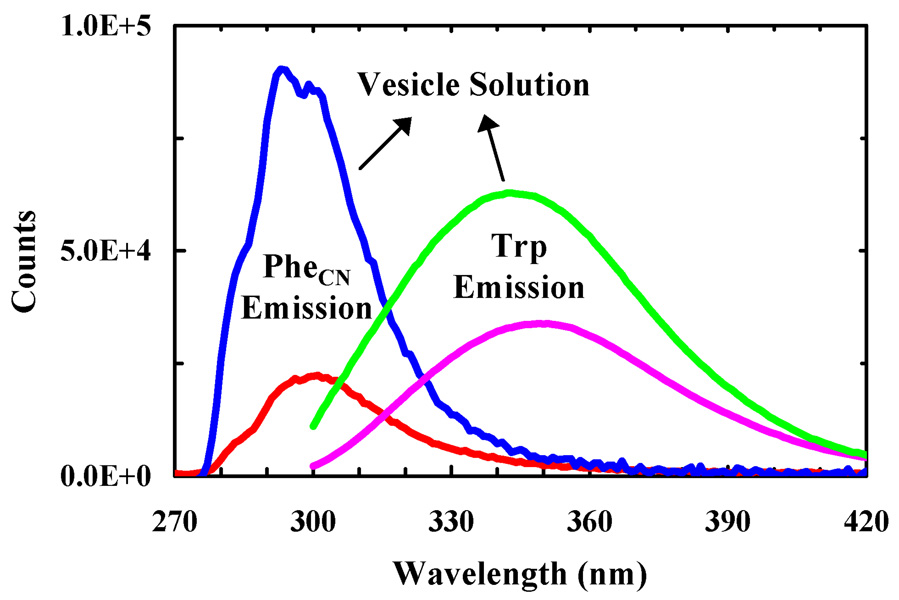
Figure 1.
Fluorescence spectra of anti-αIIb (pink and green) and anti-αIIb-PheCN (red and blue) in buffer and POPC/G vesicle solutions, as indicated. The peptide and lipid concentrations were 2.5 µM and 0.86 mg/mL, respectively. The excitation wavelengths were 290 and 240 nm for anti-αIIb and anti-αIIb-PheCN, respectively.

