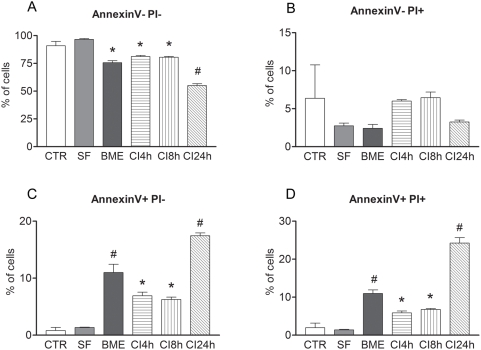
Figure 5. Cell death analysis of MSC.
Graphic representations of the percentage of MSC that are: A) live cells (Annexin− PI−); B) necrotic (Annexin− PI+); C) early apoptotic (Annexin+ PI−); or D) late apoptotic (Annexin+ PI+) in the non-induced (control, CTR), serum-free (SF), pre-induced (BME) or chemically-induced (for CI4 h, CI8 h and CI24 h). Mean±standard error. p<0.05, # different from every other group; * different from non-induced and serum-free.

