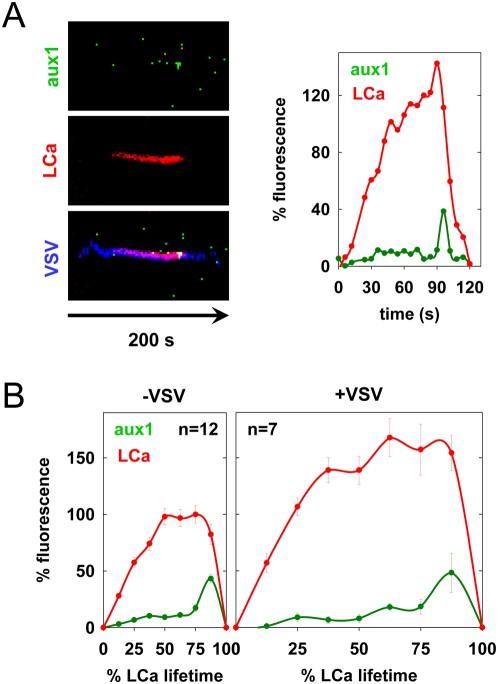
Figure 4. Auxilin recruitment during uncoating of vesicles containing VSV.
(A) Kymograph views of VSV internalization by a BSC-1 cell expressing tom-LCa and eGFP-aux1 (left), along with a graph of the kinetics of auxilin (aux1) and clathrin (LCa) recruitment (right). The internalization event shown is depicted in Video S5. (B) Graphs of the average kinetics of clathrin and auxilin recruitment to CCP containing (right) or lacking (left) virus. Average fluorescence intensity and time are expressed as a % relative to CCV lacking virus observed in the same cells. Fluorescence intensity was calculated at 8 equally-spaced intervals and is plotted+/−standard error. Viral events were from 2 independent cells, and events lacking virus were analyzed in 1 of these cells. The difference between the maximum aux1 fluorescence in pits containing and lacking VSV is not statistically significant (Student's t-test: p = 0.1).

