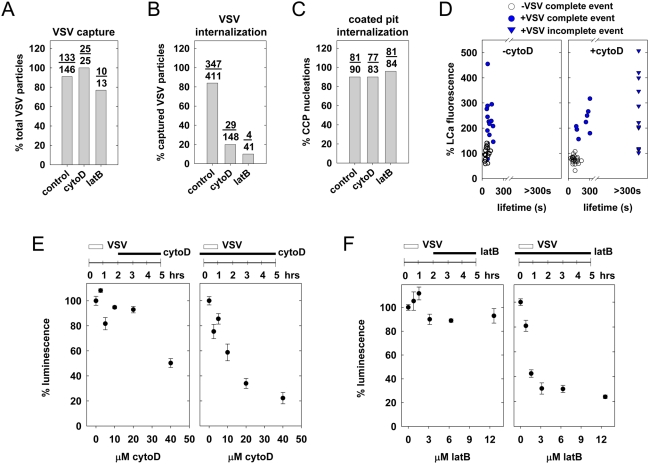
Figure 6. Chemical inhibition of actin polymerization reduces the efficiency of VSV internalization.
(A–D) Where indicated, BSC-1 cells were treated with 20 µM cytochalasin D (cytoD), or 6.3 µM latrunculin B (latB) for 10 min. prior to inoculation with VSV and acquisition of time-lapse images. Video S9 depicts the effect of cytoD treatment on VSV internalization. The % of attached particles captured by a coated pit (A), and subsequently internalized (B), along with the % of CCP lacking virus that complete within 80 s (C), were plotted to generate the graphs shown. Data in (A) and (B) are from 28 independent control cells, 5 cells treated with cytoD, and 2 cells treated with latB. Data in (C) are from 2 independent cells in each condition. (D) The graphs show clathrin fluorescence vs. CCV lifetime for complete (circles) or incomplete (triangles) internalization events, for pits containing (blue) or lacking (open circles) VSV. Clathrin fluorescence is expressed relative to its intensity in untreated pits lacking virus, which were set to 100. Internalization was analyzed from 4 cells in the absence of cytoD (16 complete VSV internalizations, 23 complete non viral events) or 3 cells (8 complete and 11 incomplete VSV events, 24 complete non viral events) in the presence of cytoD. The peak clathrin fluorescence in viral events was not statistically significantly different in the presence and absence of cytoD (Student's t-test p = 0.2 for complete and incomplete events). (E) Effect of cytoD on VSV entry and gene expression. Cells were infected with rVSV-LUC (MOI = 0.5) and exposed to the indicated concentration of cytochalasin D 2–5 h p.i. (left) or prior to infection −0.5–5 h p.i. (right). Luminescence values were measured at 5 h p.i. as described in Materials and Methods. The values shown are the mean of triplicates+/−standard deviation. (F) Effect of latB on VSV entry and gene expression. Cells were treated as in (E) except latB was substituted for cytoD.

