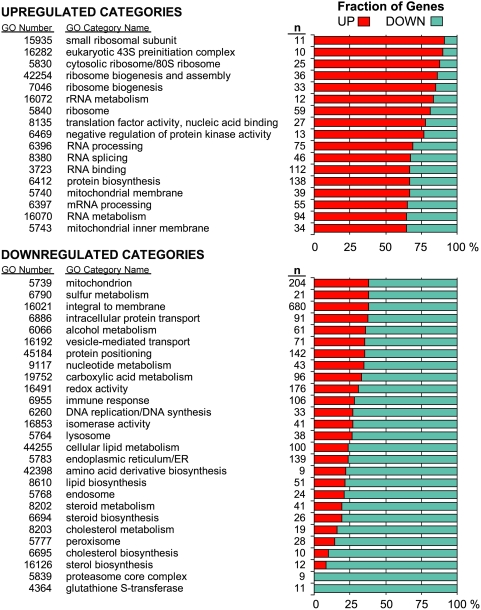
Figure 3. GO categories with largest relative fractions of upregulated or downregulated genes.
Each stacked bar graph displays the relative upregulated or downregulated fractions of the total number of genes (n = 100%) significantly altered by CR within a given GO category returned by FuncAssociate (adjusted p<0.05). The upregulated fraction is shown in red and the downregulated fraction is shown in blue.

