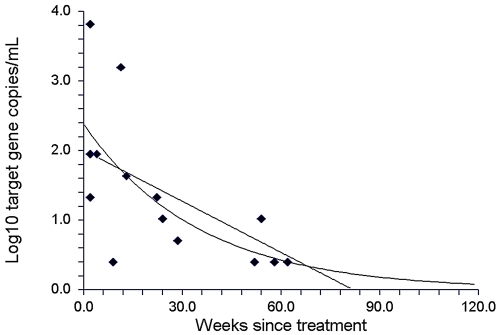
Figure 3. Cell-free Schistosoma DNA concentrations after treatment.
DNA concentrations were plotted only for those patients still showing cell-free Schistosoma DNA in plasma after treatment. These data were pooled from patients who had been followed prospectively after being diagnosed with Katayama syndrome, as well as from patients examined retrospectively after concluded treatment. Linear regression analysis yielded the graph equation Y = 2.03−0.02 X. Exponential regression yielded the graph equation Y = e ∧ −0.02 (X−30.4).

