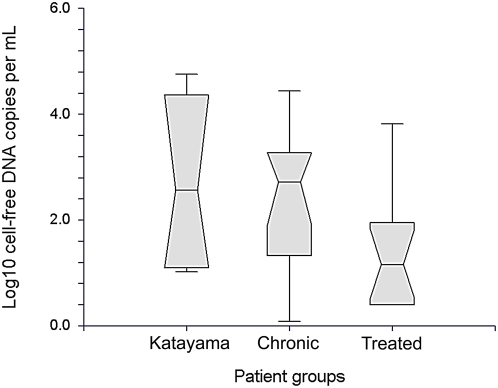
Figure 4. Box plot analysis of cell-free DNA concentrations in patients with Katayama syndrome (first visits only), patients with chronic disease, and all patients who had positive plasma PCR after treatment (pooled from treated Katayama syndrome patients and patients examined retrospectively after treatment).
Boxes represent the innermost two quartiles (25%–75% percentiles = interquartile range, IQR) of data. The whiskers represent an extension of the 25th or 75th percentiles by 1.5 times the IQR. The notches represent the median +/−1.57 IQR √n. If the notches of two boxes do not overlap, the medians ( = notch centers) are significantly different (true for the active disease vs. the treated group).

