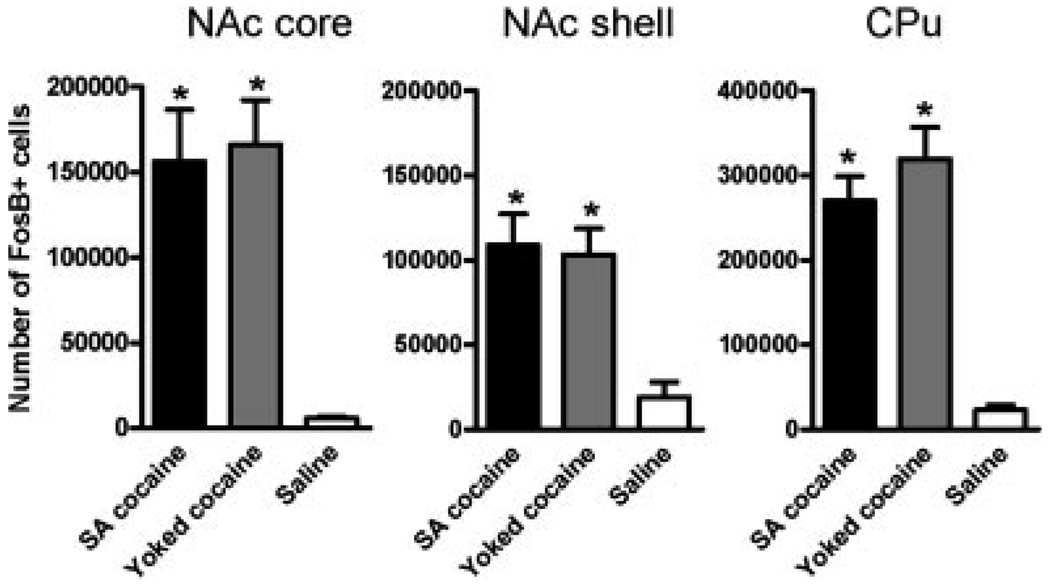
Fig. 6.
Quantification of ΔFosB induction in striatal regions after chronic cocaine self-administration. The bar graphs show the mean number of ΔFosB+ cells in control animals and in animals subjected to the cocaine treatments, in the core and shell subregions of the nucleus accumbens (NAc) and the dorsal striatum (caudate- putamen, CPu). Data are expressed as mean ± SEM (n = 6–10 animals in each group). *P < 0.05 by t-test. Note no significant differences between self-administering animals and their yoked counterparts.

