Figure 5.
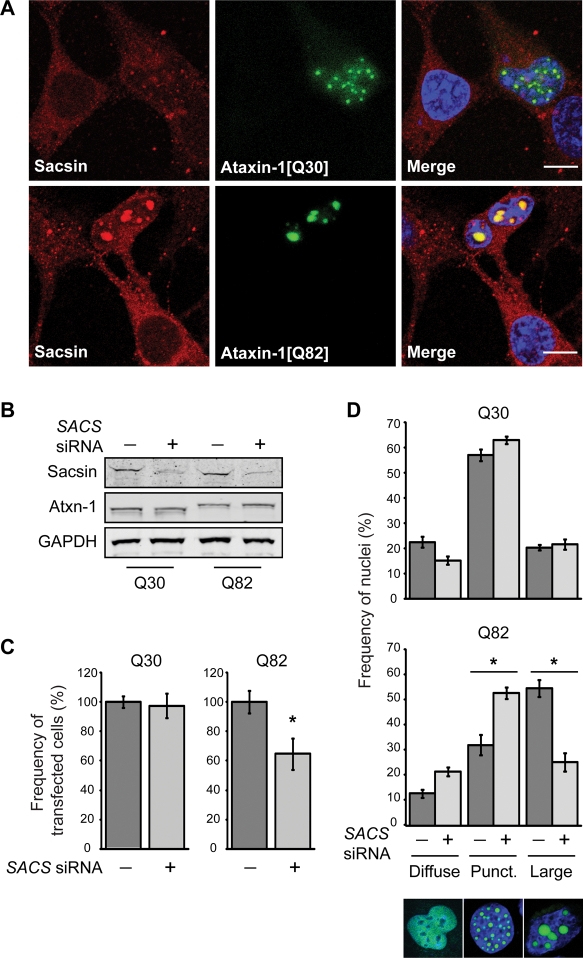
Sacsin knockdown reduces the incidence of cells with large nuclear inclusions of polyglutamine-expanded ataxin-1. (A) Confocal immunofluorescence microscopy showing recruitment of sacsin to ataxin-1 nuclear inclusions and in particular large inclusions of GFP-ataxin-1[82Q]. The scale bar represents 10 µm. (B) Western blot analysis confirming sacsin knockdown. Total cellular levels of ataxin-1 were not significantly affected by sacsin knockdown. (C) The total number of cells expressing GFP-ataxin-1 was compared in cells co-transfected with SACS siRNA, or a scrambled control siRNA. Sacsin knockdown did not affect the number of cells expressing GFP-ataxin-1[30Q], but did cause a reduction in the number of cells expressing GFP-ataxin-1[82Q] after 48 h. The frequency of ataxin-1-expressing cells with SACS siRNA is shown as a percentage of the remaining ataxin-1-expressing cells in the control siRNA treatment. (D) The distribution of ataxin-1 in the nuclei of SH-SY5Y cells co-transfected with GFP-ataxin-1[30Q] or GFP-ataxin-1[82Q] and SACS siRNAs, or a scrambled control siRNA, was quantified. Confocal images of nuclei with representative ataxin-1 distributions are shown. Ataxin-1 was either diffusely localized within the nucleus, localized to multiple small punctate foci, or present in fewer larger inclusions. Sacsin knockdown reduced the number of cells with large inclusions in cells expressing GFP-ataxin-1[82Q]. A minimum of 50 transfected cells were scored for each treatment from five separate transfections. Scoring was conducted blind to experimental status 48 h post-transfection. P < 0.05 are indicated with an asterisk.

