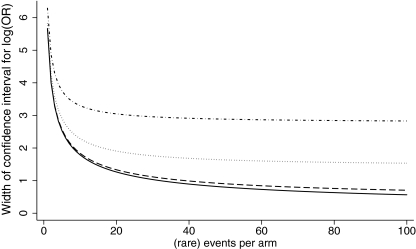
Fig. 3.
Effect of ranges for bias on the approximate width of the CI for the bias-adjusted log-odds-ratio, assuming rare events and no intervention effect (ranges refer to a symmetric relative risk scale, as shown in Fig. 2):  , no bias;
  , 67% range (0.9, 0.9);
  , 67% range (0.7, 0.7);
  67% range (0.5, 0.5)

