
Figure 2.
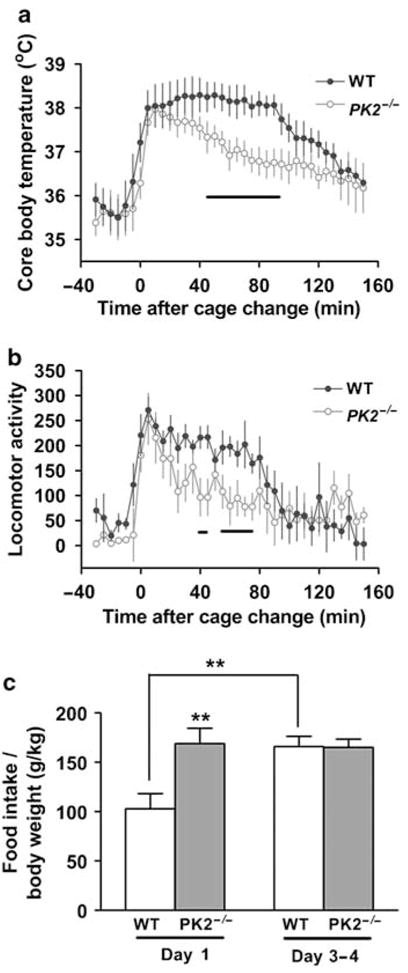
Altered adaptation of PK2−/− mice to new environments. (a) The core body temperature before and following a cage change at ZT 4 in WT (blue closed circles) and PK2−/− mice (red open circles) (genotype: F (1) = 55.57, P < 0.0001, two-way ANOVA). (b) Locomotor activity before and following a cage change at ZT 4 in WT (blue closed circles) and PK2−/− mice (red open circles) (genotype: F (1) = 20.19, P < 0.0001, two-way ANOVA), n = 6 mice/genotype. The lines under the curve of (a) and (b) indicate the P-values between genotypes are less than 0.05, Student’s t-test. (c) The food intake of WT and PK2−/− mice during day 1 and days 3–4 in CLAMS chambers, n = 12 mice/genotype (genotype × time, F (1) = 6.37, P < 0.02, two-way ANOVA; **P < 0.01; post hoc Bonferroni’s t-test).