
Figure 2.
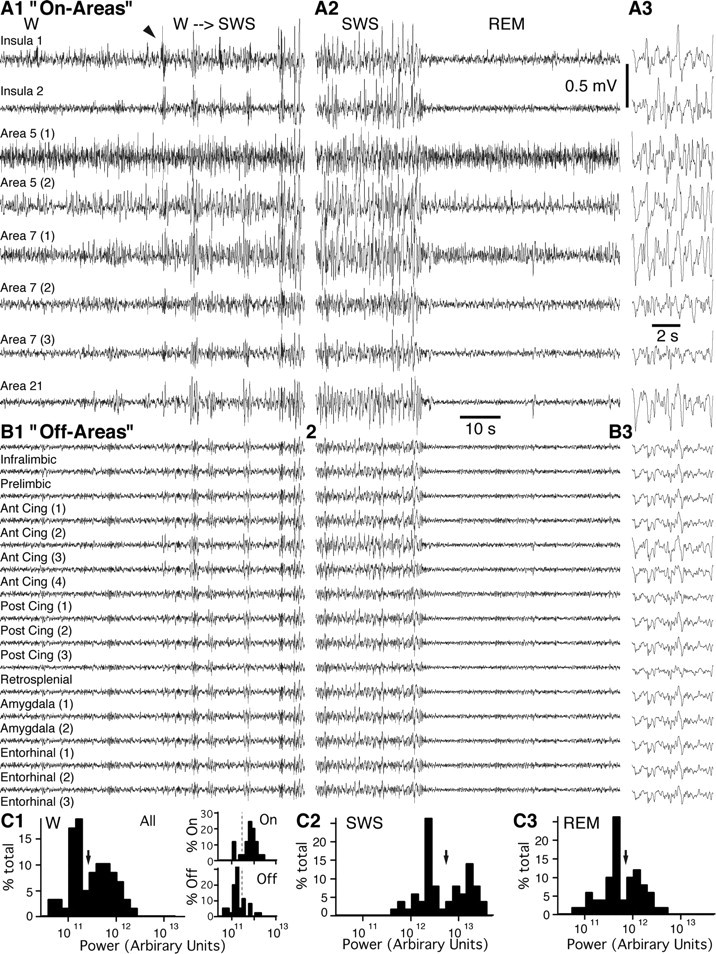
LFP power is lower in task-off than task-on regions. A, B, LFPs recorded simultaneously in task-on (A) or task-off (B) regions in waking (W), at the transition from waking to slow-wave sleep (W→SWS), and during paradoxical sleep (REM). A3 and B3 show an expanded period of SWS. C1–3, Frequency distribution of total power in W (C1), SWS (C2), and REM sleep (C3). Note that all histograms are bimodal. Arrows indicate cutoff between low and high modes. C1 (insets), Separate frequency distributions of LFP power for task-on and task-off regions during wakefulness.