
Figure 3.
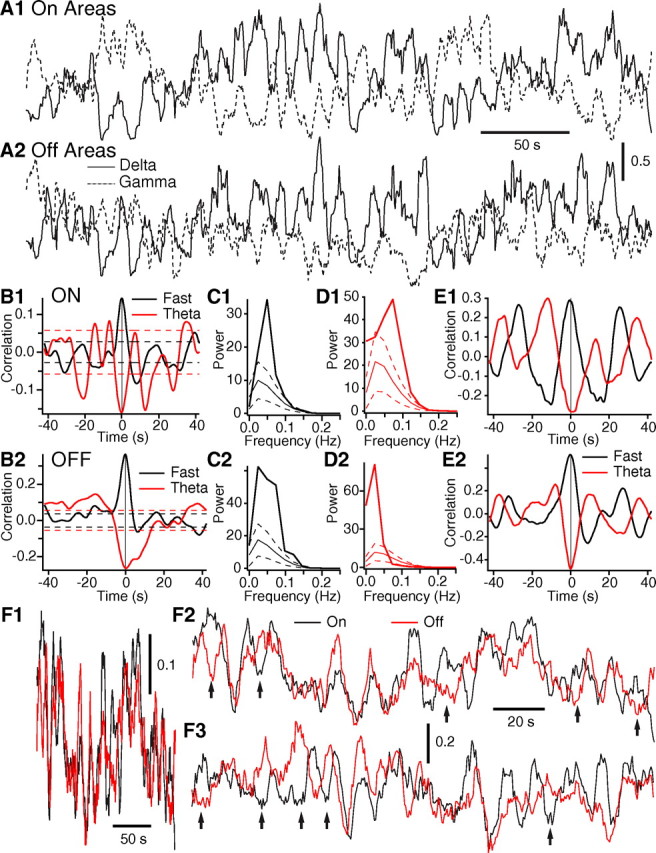
Task-on and task-off regions exhibit slow LFP power fluctuations. A, Average delta (continuous line) and gamma (dashed line) power fluctuations in task-on (A1) and task-off (A2) regions during a slow-wave sleep epoch. B, Correlation between unit activity and LFP power in the theta (red) and fast (black) frequency bands in task-on (B1) and task-off (B2) regions. Average of data obtained in 10 different waking epochs obtained from three cats. C, D, FFT of average unit-power crosscorrelograms shown in A for fast (C1, D1) and theta (D1, D2) LFP activity. Thick lines indicate power of actual correlogram, whereas thin solid line indicate power ±1SD (dashed lines) of shuffled correlograms. E, Same as in B but for a single waking session where the power-unit relations were particularly strong and rhythmic. F, Gamma power fluctuations of task-on (black) and task-off (red) regions in waking shown with a slow (F1) and fast (F2–3) time base. Same epoch is shown in F1–2. Arrows in F2–3 point to periods of anticorrelated fluctuations in gamma power in task-on and task-off regions.