Figure 5.
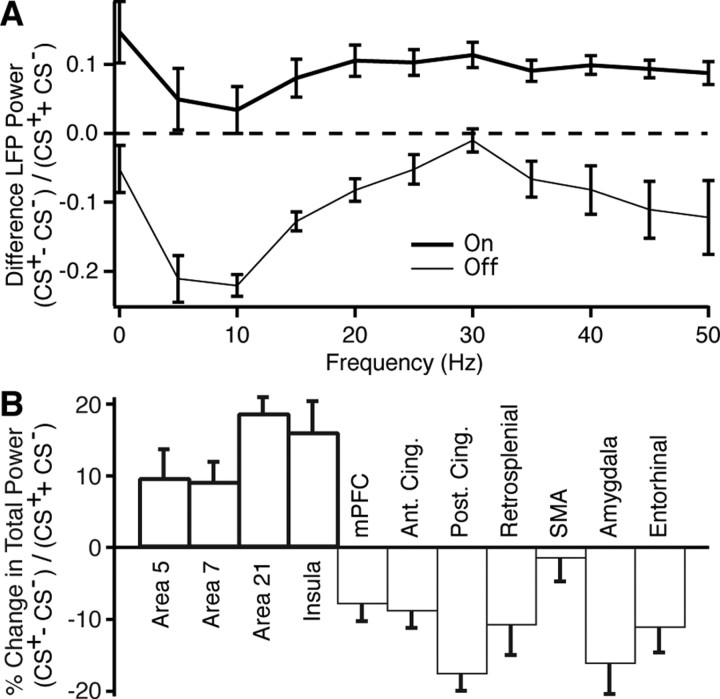
Compared with the CS−, LFP power during the CS+ shifts in opposite directions in task-on and task-off regions. A, Difference in LFP power during the CS+ versus the CS− (y-axis) in various frequency bands (x-axis) in task-on (thick line) and task-off (thin line) regions. B, Normalized change in total power in different task-on (thick lines) and task-off (thin lines) regions.

