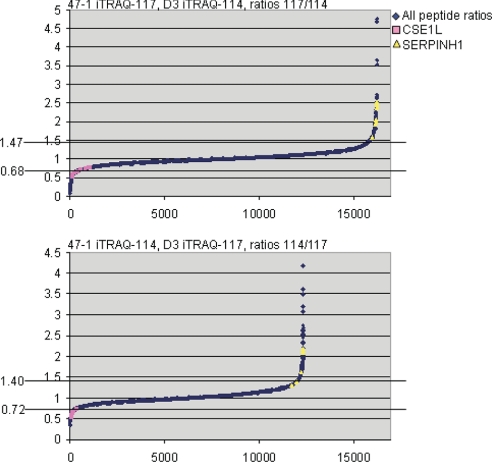
Fig. 2.
The overall distribution of relative expression level ratios for all peptides in trisomy 21 as measured by the forward and reverse labeling in the iTRAQ experiment. The majority of peptides have an expected ratio of close to 1. The 95% confidence intervals are indicated by horizontal lines, and ratios at these intervals are indicated on the left. As examples of proteins with significantly differing expression in trisomy 21, all peptides from the proteins CSE1L (purple) and SERPINH1 (yellow) are indicated, and these show clearly disturbed expression in 47-1 (+HSA21) compared with D3 (euploid control) cells.

