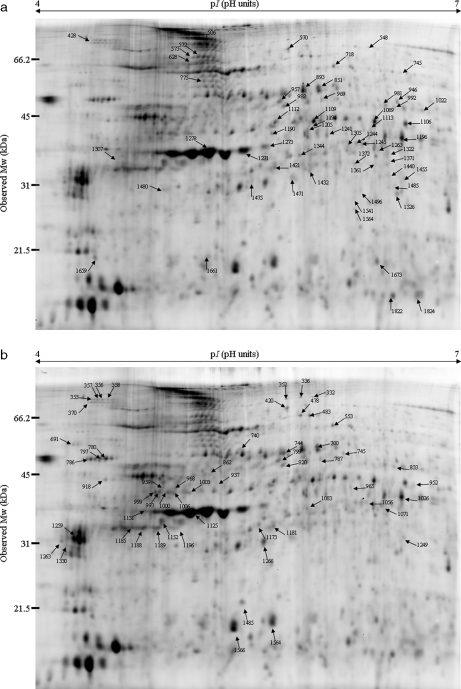
Fig. 3.
Representative 2D gels showing the protein expression profiles obtained from X. laevis tadpoles exposed for 72 h to the PCB mixture Aroclor 1254. Proteins of the samples obtained for the different experimental conditions were differentially labeled with Cy3 and Cy5. An internal standard composed of equal amounts of each sample and labeled with Cy2 was added. Labeled samples (25 μg of each of the Cy3 and Cy5 labeled samples and of the Cy2 labeled internal standard) were loaded on 24-cm pH 4–7 non-linear IPG strips and subjected to IEF. Proteins were further separated by SDS-PAGE (12.5%) in the second dimension. Arrows and numbers allocated by the DeCyder software indicate spots with significant changes in intensity (p < 0.01, Student's t test in four independent gels). a, 2D gel image with proteins differentially expressed in the 0.1 ppm condition. b, 2D gel image with proteins differentially expressed in the 1 ppm condition.

