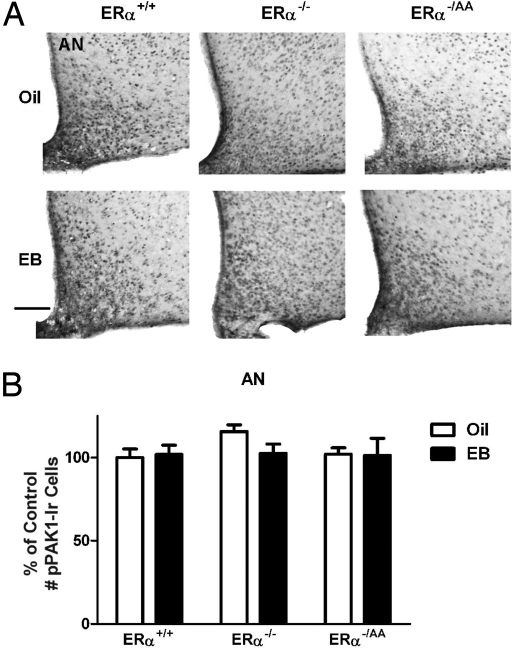
Fig. 4.
E2-independent pPAK1-Ir in the AN of female ERα+/+, ERα−/−, and ERα−/AA mice. Animals were treated as described in Fig. 3. (A) Representative photomicrographs of pPAK1-Ir in the AN and adjacent regions of OVX mice 1 h after oil or EB injection. (Scale bar: 100 μm.) The number of pPAK1-Ir cells in the AN was not significantly different after EB treatment compared with values in animals receiving corresponding oil treatment (B). Data are represented as the mean ± SEM (n = 5–8).

