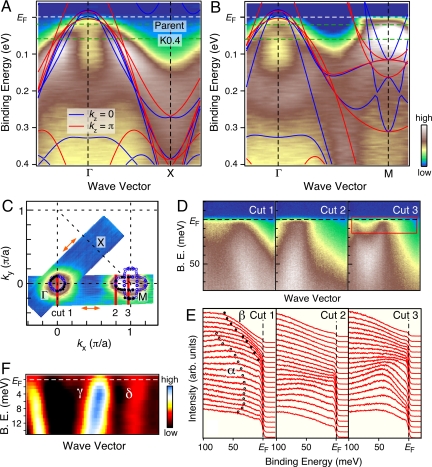
Fig. 1.
Fermi surface and band structure of electron-doped BaFe1.85Co0.15As2. (A and B) ARPES intensity plots of BaFe1.85Co0.15As2 (Tc = 25.5 K) as a function of wave vector and binding energy measured at 8 K along the ΓX (A) and the ΓM (B) lines with the He Iα (hν = 21.218 eV) resonance line, together with the band dispersion from the first-principle calculations for kz = 0 and π (blue and red curves, respectively). Calculated bands for BaFe2As2 (15) were shifted downward by 40 meV and then renormalized by the factor of 2. Green broken lines denote the expected EF positions of BaFe2As2 and Ba0.6K0.4Fe2As2. (C) FS contour determined by plotting the ARPES spectral intensity integrated within ± 5meV with respect to EF. Black filled circles show the kF positions determined by tracing the experimental band dispersion, whereas blue open circles are symmetrized kF points obtained by assuming a 4-fold symmetry with respect to the Γ and M point, respectively. The symmetrized kF points (blue open circles) coincide well with the original ones (black filled circles), confirming the validity of this symmetry operation. Orange arrows show the polarization vector of the incident light for each cut. (D) ARPES spectral intensity at 8 K as a function of wave vector and binding energy. (E) Corresponding EDCs measured along 3 representative cuts 1–3 shown in C. Circles in E traces the energy dispersion of the α and β bands. (F) Second derivative plot of MDCs along cut 3 to highlight the presence of another weaker electron-like band (δ).

