Fig. 2.
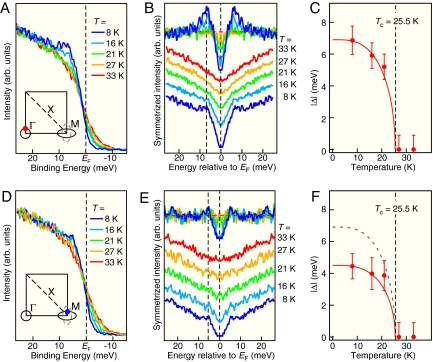
Temperature dependence of the superconducting gap. (A) T dependence of EDC measured at a kF point on the β FS (red dot in Inset). (B) Symmetrized EDCs and the same but divided by the spectra at T = 33 K. Dashed line denotes the position of SC coherence peak. (C) T dependence of the SC gap size. Solid line is the BCS mean-field gap with Tc = 25.5 K and Δ(0) = 7 meV. (D–F) same as A–C but measured on the kF point of the ellipsoidal electron pocket. Dashed line in F is the same as the solid line in C.

