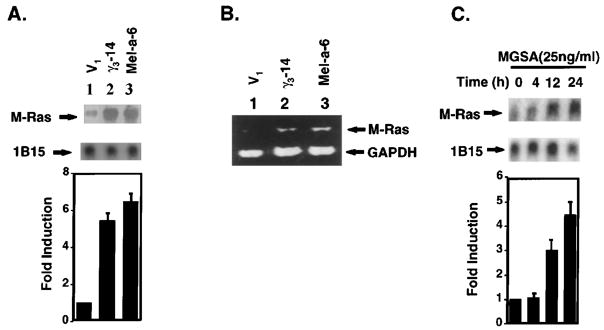
Figure 1.
MGSA/GRO up-regulates M-Ras expression in mRNA level in melanocytes (a) Northern blot analysis of M-Ras: Total cellular RNA (20 μg) from V1 (lane 1), γ3-14 (lane 2) or Mel-a-6 (lane 3) cells was extracted, separated on a formaldehyde-agarose gel, and transferred to a Nytran Plus filter. The filter was hybridized with the 32P-labeled mouse M-Ras differential display fragment. Hybridizing bands were identified at 1.0 kb. The filter was re-probed with 32P-labeled cyclophilin (1B15). The relative M-Ras band density is M-Ras band density normalized to cyclophilin (1B15) band density quantitated by a densitometer. The bar graph presents a mean (±s.e.m.) of fold induction of relative M-Ras band intensity from three independent experiments (lower panel). (b) RT– PCR: Total cellular RNA (20 μg) from V1 (lane 1), γ3-14 (lane 2) or Mel-a-6 (lane 3) cells was extracted and RT–PCR amplification was performed as described in Materials and methods, using specific oligonucleotides (5′ primer: ACCAGCGCTGTTCCAAGTGAA; 3′ primer: TCACAAGATGACACA CTGCAG). The post-PCR products were analysed in an ethidium bromide-stained 1.5% agarose gel. (c) Northern blot analysis of M-Ras induced by exogenous MGSA/GROα: Total cellular RNA (20 μg) from parental melan-a cells treated with recombinant human MGSA/GROα at 25 ng/ml for the indicated period was used in Northern blot analysis as described above. The relative M-Ras band density is M-Ras band density normalized to cyclophilin (1B15) band density quantitated by a densitometer. The bar graph presents a mean (±s.e.m.) of fold-induction of relative M-Ras band intensity from three independent experiments (lower panel)

