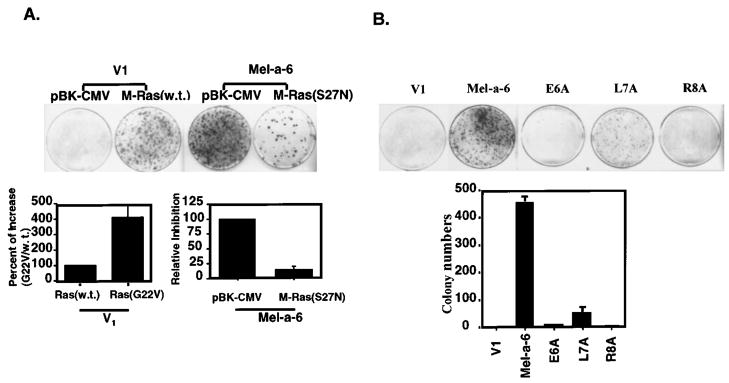
Figure 6.
M-Ras induces focus formation and dominant negative M-Ras inhibits MGSA/GROα-induced transformation. (a) V1 or Mel-a-6 cells were cotransfected with a puromycin resistant vector (pBABE) and either a pBK/CMV, wild-type M-Ras, dominant active M-Ras (G22V) or dominant negative M-Ras (S27N). The cells were cultured in 10% FBS DMEM with G418 and 1 μg/ml puromycin. Foci of transformed cells were stained with crystal violet and counted 18 days after transfection. Each data point in the bar graph represents the mean (±s.e.m.) of fold induction from a total of six different platings in three independent experiments. (b) The V1, Mel-a-6, E6A, L7A or R8A cells were cultured in 10% FBS DMEM and the foci were stained with crystal violet and counted 18 days after transfection. The data shown represents one of three independent experiments with similar results each time (top panel). Each data point represents the mean (±s.e.m.) of colonies of six different platings in three independent experiments (lower panel)

