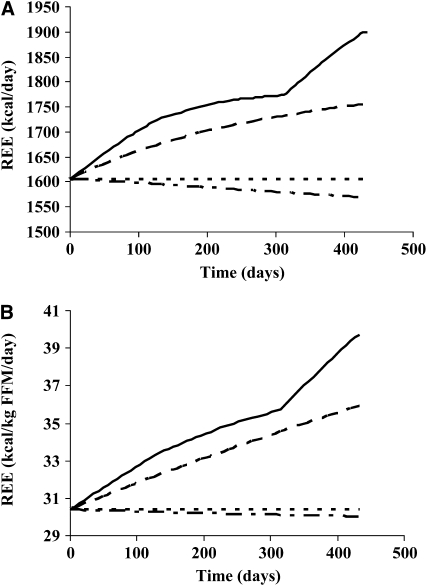
FIGURE 5.
A, B: Simulation of resting energy expenditure (REE) over 62 wk based on measured liver and spleen masses from the retrospective colorectal cancer patient cohort (n = 34). All calculations are based on an assumed liver-specific metabolic rate of 200 kcal · kg−1 · d−1 and a spleen-specific metabolic rate of 80 kcal · kg−1 · d−1. The original cachexia simulation (constant: 1.8 kg liver and 250 g spleen) (14) (dashed curve) can be contrasted with the cachexia simulation specifying the organ masses match the data at different time points from the retrospective cohort computed tomography images (Table 1) (solid curve). The healthy reference simulation in energy balance (constant: 1.8 kg liver and 250 g spleen) (dotted curve) and the reduced energy intake simulation (dashed dotted curve) are also shown (13).

