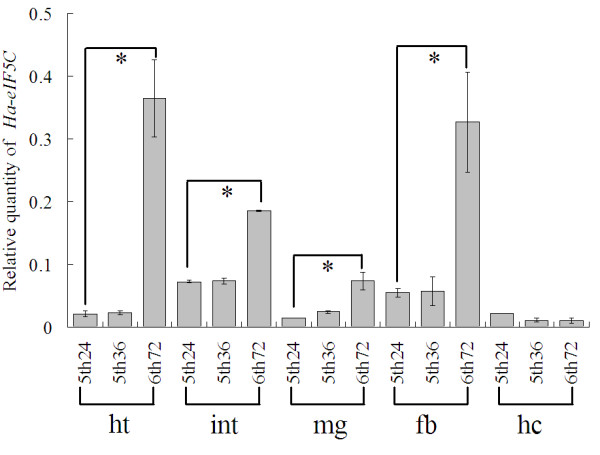
Figure 4.

QRT-PCR analysis of gene expression in five tissues during larval feeding, molting and metamorphosis. ht: head-thorax, int: integument, mg: midgut, fb: fat body, hc: haemocytes. 5th24 = 5th instar larvae 24 h after ecdysis, 5th36 = 5th instar larvae 36 h after ecdysis (5th-HCS, with head capsule slippage), 6th72 = 72 h after ecdysis (wanderting 0 d, metamorphically committed larvae). Error bars represent the standard deviation in three replicates. An asterisk indicates significant differences (Student' s t-test, *: p < 0.05).
