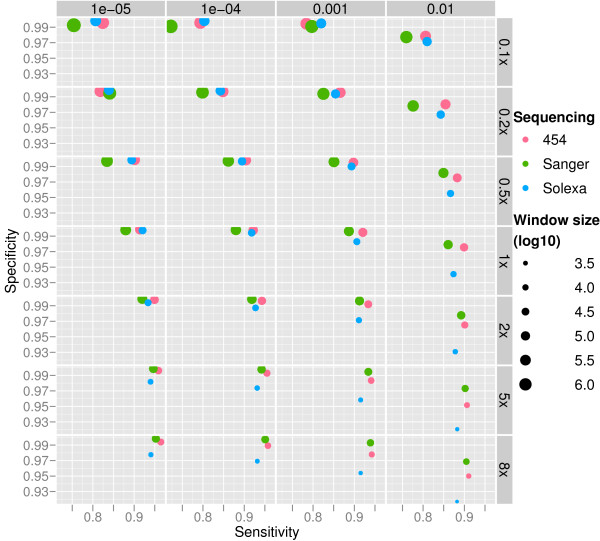
Figure 3.
Performance of CNV-seq. The performance of CNV-seq on data simulating 454, Sanger and Solexa methods. Results are shown for 0.1×–8× coverages (right) and p-value range of 10-5-10-2 (top). Each dot represents an average of 100 simulations and the size of the dots represents the window (log10) size, i.e. resolution used. The window sizes are calculated using equation (5).

