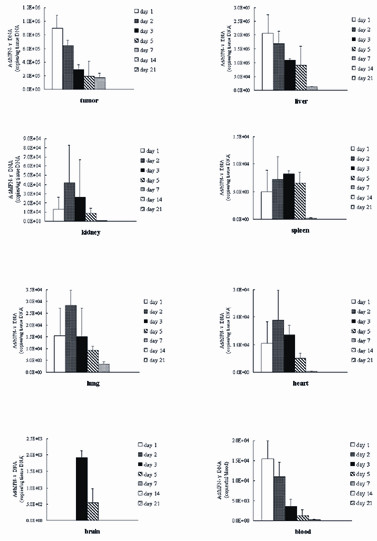
Figure 1.

Ad-IFNγ concentrations in the tumor, heart, liver, spleen, lung, kidney, brain, and blood at different time points after intratumoral injection of Ad-IFNγ. The dose of injection was 1 × 10¹⁰ VP/tumor. Data represent mean ± SD of three mice. Representative results from two independent experiments are shown.
