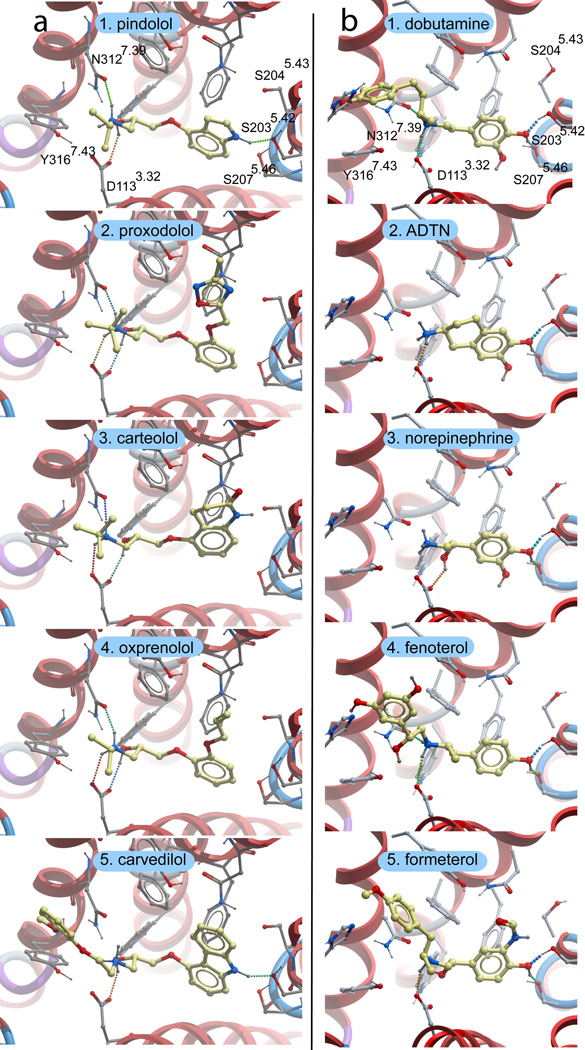
Fig. 6.
Docked conformations of top-scoring ligands for the (a) carazolol-refined antagonist bound model and (b) 1 Å shifted agonist-bound receptor model. The compounds shown correspond to the five top scoring ligands from panels (a) and (b) of Fig. 5. For all models, the receptor backbone is drawn in ribbons. Ligand is in shown in yellow sticks, receptor sidechains in grey sticks, and hydrogen bonds are depicted with dotted lines. Residue numbering is shown in the two top panels as a reference for the sidechains in the panels below

