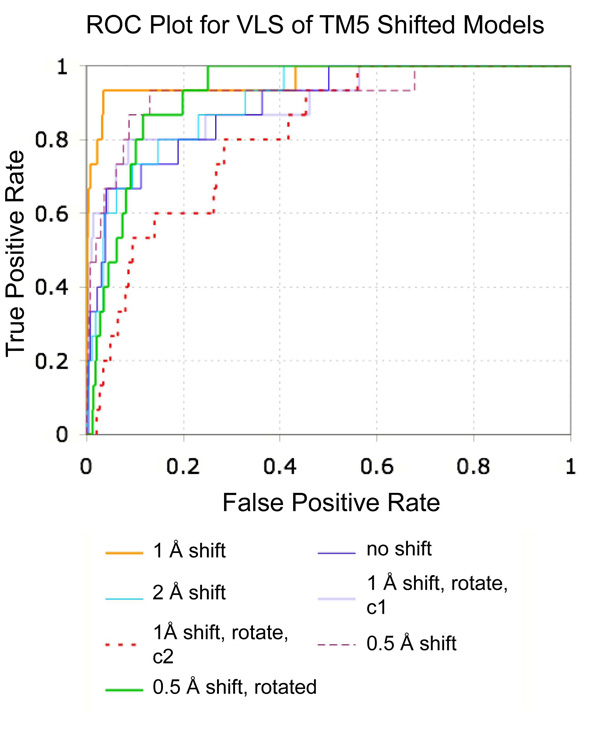
Fig. 7.
ROC plot comparing VLS results for seven hypothetical agonist bound models of β2AR. The shift and/or rotation of TM5 for each model is noted in the legend. The labels “conf 1” and “conf 2” refer to two distinct low energy ligand binding conformations observed for the 1.0 Å shift plus 5° rotated TM5 model. Known agonist compounds were considered as true positives, while antagonists and ligands for other receptors were considered false positives. All seven models were assessed using the 1K test set consisting of 954 compounds

