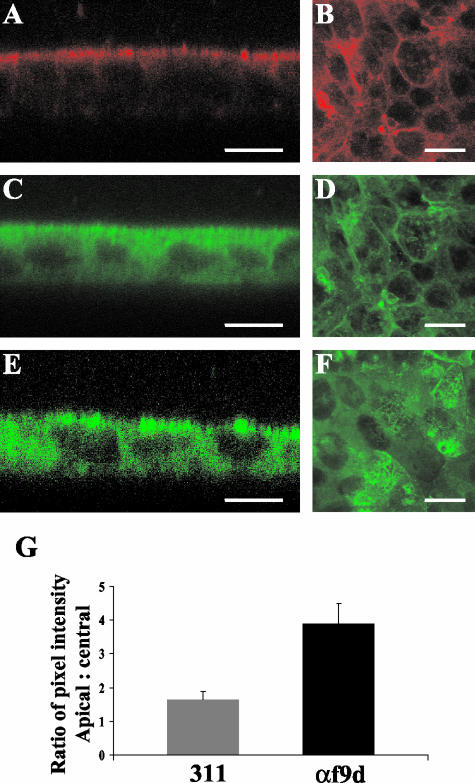
Figure 3.
T84 cell monolayers express a polarized distribution of Tm5a and Tm5b. (A–F) Mature T84 cell monolayers were labeled with αf9d (A and B), 311 (C and D) and CG3 (E and F) antibodies. A-D is the same monolayer costained with αf9d and 311. The antibody distribution was analyzed by Confocal Laser Scanning Microscopy. Images in the vertical plane (xz) are shown on the left and images in the horizontal plane (xy) are shown on the right. The differential staining pattern between αf9d and 311 represents Tm5a and/or Tm5b. Bar, 10 μm. (G) The mean apical and central pixel intensity was measured across the apical and central region of the individual monolayers. The apical:central mean pixel intensity ratios for αf9d and 311 were compared in costained monolayers and are represented as the mean ± SD for each group. Results represent the average of 8 costained monolayers.

