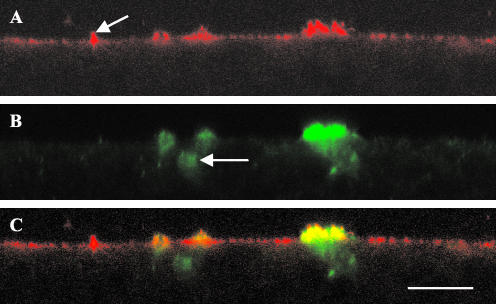
Figure 7.
immunofluorescence confocal microscopy images of T84 cell monolayers costained for tropomyosin isoforms and CFTR. All images are in the vertical plane. (A) αf9d antibody (Tm 3, 5a, 5b, and 6). The arrow indicates an area of enriched αf9d staining in the apical membrane not associated with CFTR; (B) CFTR antibody; (C) Overlay of image A and image B. Yellow highlights areas of colocalization. Bar, 10 μm.

