Figure 8.
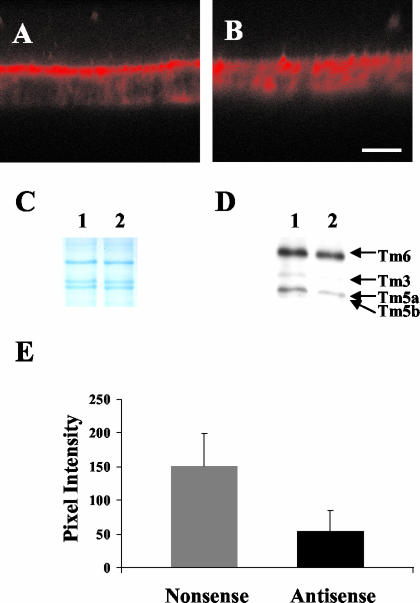
Effect of antisense and nonsense oligonucleotides against Tm5a and Tm5b on the distribution of αf9d antibody staining in T84 cell monolayers. Immunofluorescent confocal microscopy images of T84 cell monolayers. Both images are in the vertical plane. Both monolayers have been stained with αf9d (Tm3, 5a, 5b, and 6). (A) Nonsense oligonucleotide 2 μM for 24 h; (B) Antisense oligonucleotide 2 μM for 24 h. Bar, 10 μm. (C and D) Western blot showing the effect of antisense and nonsense oligonucleotides against Tm5a and Tm5b on T84 cells. Protein was extracted from T84 cell monolayers following treatment with either 2 μM antisense or nonsense oligonucleotides against Tm5a and Tm5b for 24 h. (C) Gel stained with Coomassie blue showing total protein. (D) Western blot immunoblotted with the αf9d antibody (Tm3, 5a, 5b, and 6). (E) Effect of antisense and nonsense oligonucleotides against Tm5a and Tm5b on intensity of apical staining with αf9d antibody in T84 cell monolayers. The apical αf9d antibody staining pixel intensity was determined by confocal microscopy in T84 cell monolayers treated with either 2 μM antisense or nonsense oligonucleotides for 24 h. The area to be scanned was determined using the costained 311 image in order to maintain objectivity. All measurements were undertaken in the same session using identical confocal microscope intensity settings to allow comparison of absolute pixel intensity values. The mean ± 1SD for each group is depicted. (Nonsense 150.86 ± 48.28, Antisense 53.62 ± 31.62; p < 0.001)

