Figure 9.
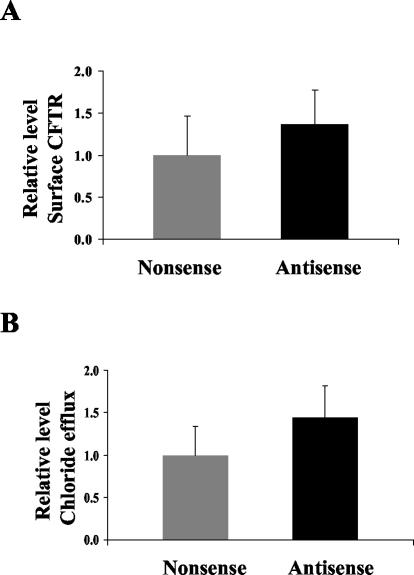
Effect of antisense and nonsense oligonucleotides against Tm5a and Tm5b on cell surface expression of CFTR and chloride efflux in T84 cell monolayers. (A) Enzyme linked CFTR surface expression assays were performed on T84 cell monolayers treated with either 2 μM antisense or nonsense oligonucleotides for 24 h. CFTR expression is represented by absorbance at 655 nm, normalized to the mean absorbance of the nonsense treated group within individual experiments. Fourteen monolayers were examined in each group. The mean ± 1 SD for each group is depicted. (Nonsense 1 ± 0.42, Antisense 1.49 ± 0.78; p < 0.001). (B) MQAE chloride efflux assays were performed on T84 cell monolayers treated with either 2 μM antisense or nonsense oligonucleotides against Tm5a and Tm5b. Cumulative chloride efflux at 15 min is represented by the mean percentage increase in fluorescence from baseline, normalized to the mean percentage increase of the nonsense group, within individual experiments. Twenty nine monolayers were examined in each group. The mean ± 1 SD for each group is depicted. (Nonsense 1 ± 0.36, Antisense 1.47 ± 0.41; p < 0.001)

