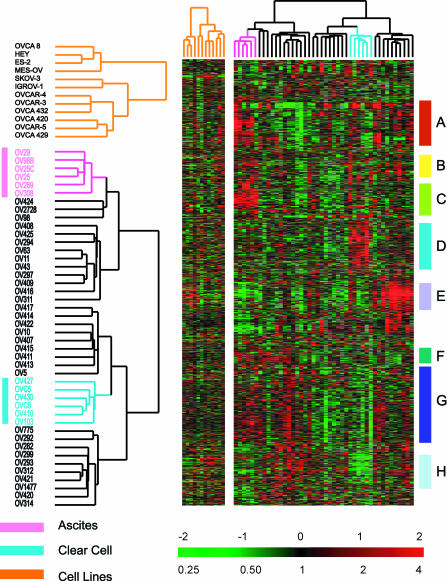
Figure 1.
Unsupervised hierarchical clustering of ovarian cell lines and ovarian cancers. Cell lines were not coclustered with the tumor specimens, because these cell lines have a very prominent proliferation cluster (Perou et al., 1999; Ross et al., 2000) that significantly influences the clustering of the tumor samples if the two sample sets are not analyzed separately. Ovarian cancer specimens and cell lines were clustered based on variation of expression of 1558 genes, as detailed in MATERIALS AND METHODS. Genes were clustered based on similarity in their expression patterns among these cancers. Eight gene clusters are highlighted in this display. (A) Lymphocyte cluster, (B) epithelial/keratin expression, (C) ascites signature, (D) clear cell overexpressed genes, (E) extracellular matrix/stromal cluster, (F) proliferation cluster, (G) heterogeneity across ovarian cases, and (H) clear cell under-expressed genes. The color contrast of the scale bar indicates the fold of gene expression change in log2 space (numbers above the bar).

