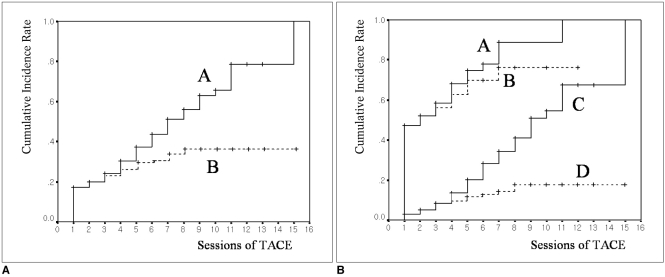
Fig. 5.
Cumulative probability curve of the extrahepatic collateral supply.
A. Kaplan-Meier plot shows the cumulative probability curve of extrahepatic collateral arteries supplying all tumors (A) and the primary tumor only (B).The gap between the two curves means the probability of extrahepatic collateral arteries for recurrent tumors during repeated TACE sessions.
B. The Kaplan-Meier plot shows the cumulative probability curve of the extrahepatic collateral arteries in patients who all had large tumors (≥ 5 cm) (A), primary large tumors (B), all small tumors (< 5 cm) (C), and primary small tumors (D). The cumulative probability of ExCAs was statistically different between large tumor (≥ 5 cm, A) and small tumor (< 5 cm, C) (log-rank test, p < 0.01). The gap between curves A and B stands for the probability of extrahepatic collateral arteries for recurrent tumors in patients with large tumors (≥ 5 cm). The gap between curves C and D represents the probability of extrahepatic collateral arteries for recurrent tumors in patients with small tumors (< 5 cm).

