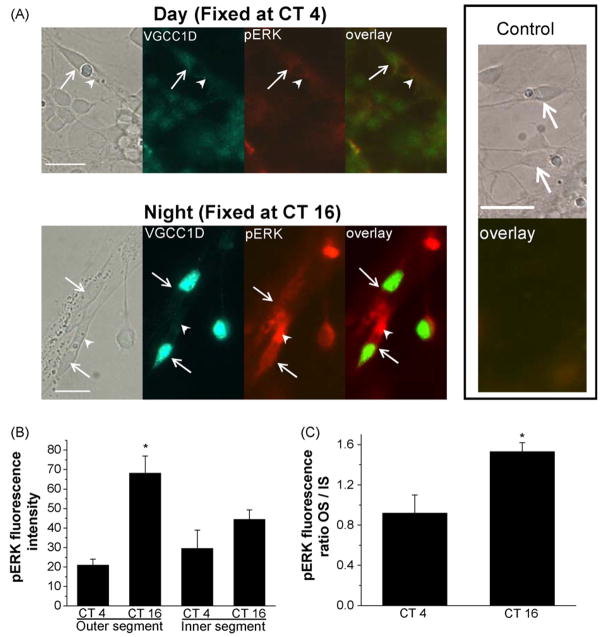
Fig. 3.
The distribution of di-phosphorylated ERK (pERK) is under circadian control in cone photoreceptors. On the second day of DD, photoreceptors were fixed at CT 4 and CT 16, followed by immunocytochemistry dual-staining with antibodies against pERK and L-VGCCα1D (VGCC1D) subunit. (A) The distribution of VGCCα1D (green fluorescence) is mainly confined to the somata (inner segment and cell bodies) of the cone photoreceptors, and the fluorescence is higher in cells fixed at CT 16 (lower panel) than at CT 4 (upper panel). The arrows indicate the photoreceptors. The overall pERK fluorescence intensity (red fluorescence) is also higher in cells fixed at CT 16 (lower panel) than in cells fixed at CT 4 (upper panel). The distribution of pERK in photoreceptors is also under circadian control. In photoreceptors fixed at CT 16 (lower panel), the pERK fluorescence intensity is much stronger in the outer segments (OS, arrow heads) than in the inner segments-cell bodies (IS). The control shows no fluorescence activity when the specific primary antibodies were omitted and substituted with serums. (B) The pERK fluorescence intensity is significantly higher in the OS of photoreceptors fixed at CT 16 than the other three groups (*p < 0.05, ANOVA, Tukey post hoc test). (C) The pERK fluorescence intensity ratio (outer segment/inner segment-cell body; OS/IS) is significantly higher in photoreceptors fixed at CT 16 than at CT 4 (*p < 0.05, Student’s t-test). The fluorescence intensity data are taken from nine photoreceptors in three different experiments of each time point (CT4 or CT16). Bar = 10 μm.

